Independent student research project. Not an official government website or health advisory.

ForeverCatch

Predicting forever chemical (PFAS) contamination in fish

Pick where a fish was caught, choose the species and enter its length. The model estimates how much PFAS the fish may contain, based on how close the spot is to military bases and urban areas, its elevation, and how large the fish is for its species. For fish caught in the United States only.

Disclaimer This tool is for research purposes only. It uses a predictive model that may have significant margins of error. It is not an official health advisory. Always refer to your local Department of Fish and Wildlife for official consumption guidelines.

Built on 1,110 EPA composite samples (each made from 3 to 5 fish) covering 48 species. Exact predictions have a median error of 3.04 ppb.

Check Your Fish

Elevation, distance to the nearest military base and distance to the nearest urban area are looked up automatically from the location you pick.

  1. Pick where it was caught
  2. Choose the species and water type
  3. Enter its length
Catch location Click the map where the fish was caught, or type coordinates below.
United States only. The model is built on U.S. EPA fish data and U.S. military base and Census urban-area records, so it only works for fish caught in the U.S.
Decimal degrees, -90 to 90
Decimal degrees, -180 to 180
Species of the fish that was caught
Total length of the fish, in inches
The kind of water body the fish came from
The location is sent to the Open-Meteo elevation and U.S. Census TIGERweb services, and your inputs go to our prediction server. We only keep anonymous counts of visits and predictions, never your inputs or anything that identifies you.

Prediction Results

Disclaimer This tool is for research purposes only. It uses a predictive model that may have significant margins of error. It is not an official health advisory. Always refer to your local Department of Fish and Wildlife for official consumption guidelines.

Estimated PFAS concentration for this catch:

Exact prediction
--

Warning: can be highly variable. Don't treat it as fact.

95% upper bound
<--
99% upper bound
<--

How to read these numbers

  • Exact prediction is our single best estimate, from an Extra Trees machine-learning model with a median error of 3.04 ppb. Individual fish can still be much higher or lower.
  • Upper bounds are the levels we are 95% and 99% confident the PFAS in this fish falls below.

How often can you eat it?

This chart is from the Great Lakes Consortium for Fish Consumption Advisories (2025). It shows how often it's OK to eat a fish based on how much PFOS is in its meat.

PFOS is one type of PFAS, and it's the main one found in fish. In a study of freshwater fish across the U.S., PFOS made up about 74% of the total PFAS on average.

PFOS in the fish (ppb)How often you can eat it
0 to 2.54 or more meals a week
Over 2.5 to 52 meals a week
Over 5 to 101 meal a week
Over 10 to 401 meal a month
Over 40Do not eat

Our estimates above count all PFAS together, not just PFOS, so the PFOS in your fish is usually a bit lower than our number. Use this chart as a rough guide. Sources: Best Practice for PFOS Guidelines, Table 1 (September 2025); Barbo et al., Environmental Research (2023).

Nearest Military Base
--
Nearest Urban Area
--
Elevation
--

What This Project Does

PFAS are persistent synthetic chemicals that have been linked to industrial sites, airports, and military installations that historically used PFAS-containing firefighting foam (AFFF). These chemicals can enter waterways and bioaccumulate in fish over time. This project explores whether a simple set of location- and biology-based inputs can produce a useful, approximate risk estimate.
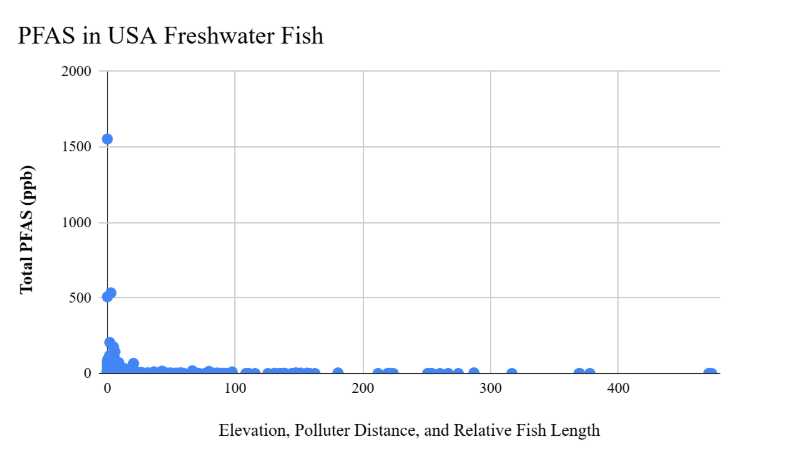
Scatter plot of total PFAS (ppb) in USA freshwater fish against a combined score of elevation, distance to the nearest military base and urban area, and relative fish length
Total PFAS (ppb) in USA freshwater fish plotted against a combined score of elevation, polluter distance (nearest military base and nearest urban area), and relative fish length (length ÷ species average), showing the rapid C/x-style decay that the quantile-regression curves are fit to.

Limitations

This tool has significant limitations that anyone using it should understand.

About the Author

I'm Alden Wang, a high school senior with a lifelong passion for fishing.

Why I built this
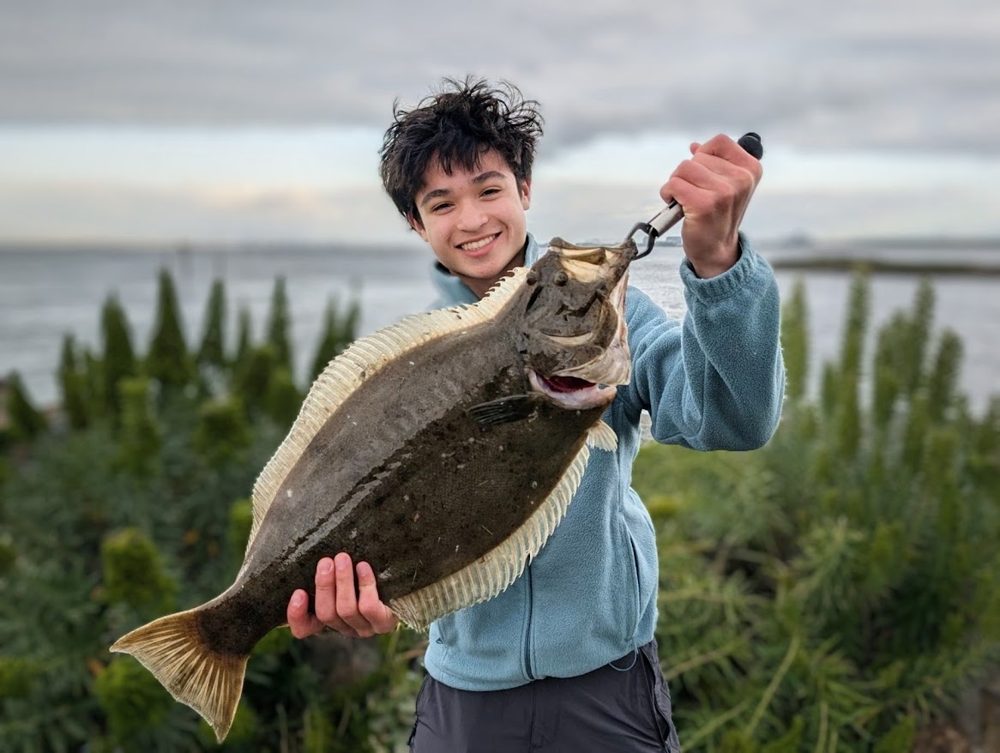
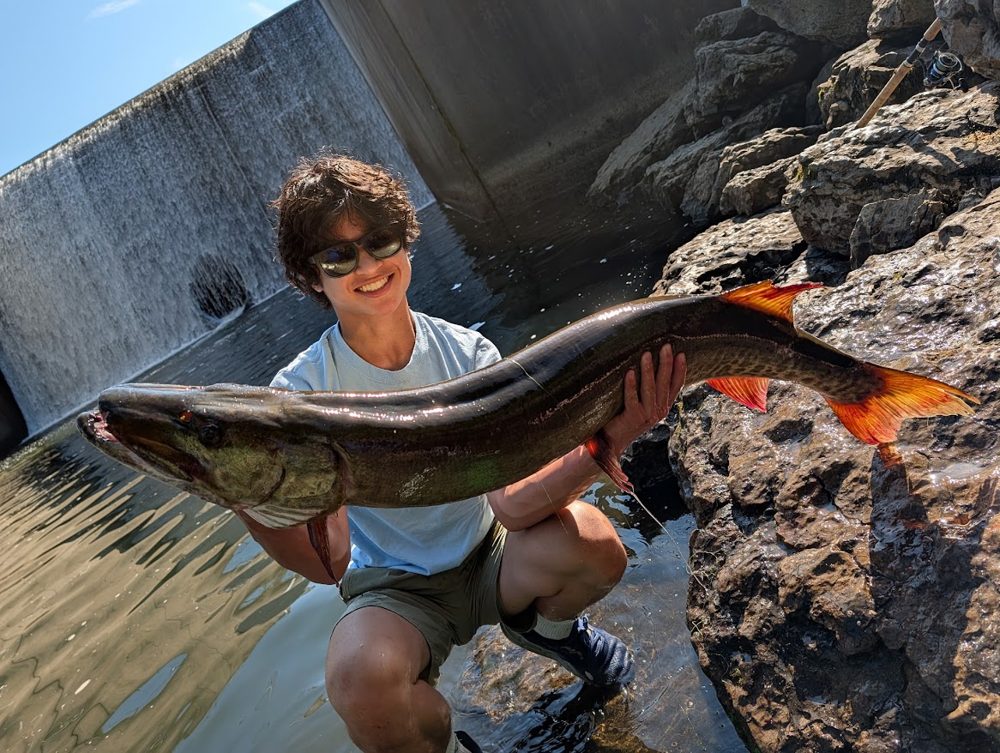
Alden holding a halibut by the water Alden holding a large muskie below a dam